Looking Past the Pavement: The Case for Maps That Zoom Out
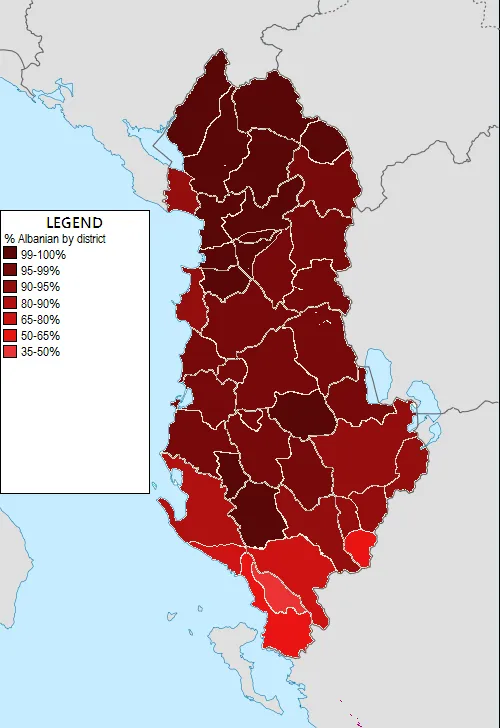
Photo: Yalens, CC BY-SA 4.0, via Wikimedia Commons
Somewhere along the way, our field decided that closeness equals importance. Modern GIS tooling rewards the zoom: parcel-level lidar, sidewalk imagery, foot-traffic traces at the city block. These are genuine achievements, and few would trade them away. But the cumulative effect is a profession that increasingly analyzes at the scale of the street corner while the questions that matter most — water, power, wildfire, migration — unfold across watersheds, grids, and regions. It is time to make the case for the small-scale map.
The Zoom Bias Is Built In
The bias is not philosophical; it is infrastructural. Consumer mapping products are engineered for wayfinding, which is inherently street-level. Enterprise platforms price by data richness, and the richest data is always the most granular. Analysts are evaluated on deliverables — site plans, corridor studies, parcel audits — that live at 1:1,200. Meanwhile, the datasets that only make sense at small scale, like a decade of aquifer drawdown or a statewide wildlife corridor, are harder to acquire, harder to style, and harder to defend in a planning commission hearing that lasts eleven minutes.
The result is a quiet de-skilling. A generation of analysts can georeference a plat but has never built a map whose primary unit of analysis is the region. Ask for a picture of watershed health across four states, and the instinct is to aggregate parcels upward — a cartographic answer to what is fundamentally a systems question.
What Only Small-Scale Maps Can Say
Some truths are simply invisible at high magnification. The decline of an aquifer does not respect city limits; it reads as a regional contour of depletion that only a 1:2,000,000 map can show. Connectivity corridors for wildlife, transmission gaps in the national grid, the shape of broadband deprivation across Appalachia — each is a story about pattern, and pattern requires distance. A hyper-local view of a single culvert tells you nothing about whether the watershed upstream is losing its capacity to absorb a hundred-year storm.
Small-scale maps also serve a civic function the zoomed-in view cannot. When state legislatures allocate water rights or interstate compacts are renegotiated, the persuasive artifact is rarely a parcel map. It is the regional synthesis — the map that lets a legislator see their district inside a larger system. That genre of cartography is not decorative; it is the visual language of collective decision-making.
Relearning to Zoom Out
Recovering this skill does not require new technology so much as renewed intention. Graduate programs might require students to produce at least one analysis whose smallest unit is the county. Agencies could fund regional synthesis products the way they fund imagery programs, treating statewide frameworks as deliverables rather than byproducts. And in daily practice, analysts might adopt a simple discipline: before publishing any local study, ask what the same data looks like one order of magnitude larger.
None of this argues against precision. The parcel and the region are complements, not rivals — the small-scale map frames the question, the large-scale map answers it. But a profession that only practices one half of that pairing will produce technically excellent answers to increasingly narrow questions.
The map that changes a policy is often the one that shows the whole system at once. We should build, teach, and defend that map as seriously as we build the rest.