Drawing the Lines: How GIS Analysis Is Exposing Electoral Inequity Across America
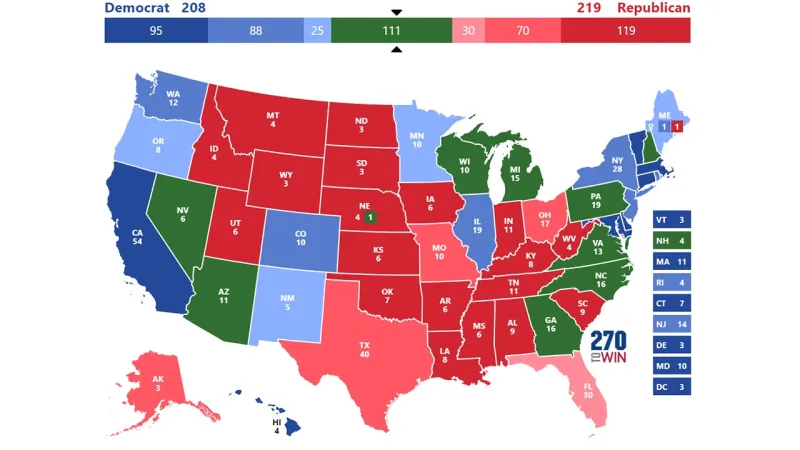
Photo: election district map voting polling place geographic data analysis, via images.foxtv.com
Every decade, following the release of census data, state legislatures across the United States undertake one of the most consequential acts of governance: the redrawing of electoral district boundaries. The process, known as redistricting, determines which communities share representation in Congress and in state legislatures. It is also, historically, one of the most contested arenas in American political life—a domain where geography and power intersect in ways that can shape electoral outcomes for a generation.
Geographic information systems have emerged as a defining technology in this landscape. Once confined to academic research and specialized legal challenges, spatial analysis of electoral data has moved into the mainstream, employed by community organizations, civil rights groups, state redistricting commissions, and federal courts alike. The ability to visualize district shapes, model demographic distributions, and calculate accessibility metrics is changing what it means to scrutinize the fairness of an election.
The Geometry of Representation
Gerrymandering—the manipulation of district boundaries to benefit a particular party or group—is not a new phenomenon. The term itself dates to 1812, when Massachusetts Governor Elbridge Gerry signed legislation creating a contorted district shape that critics compared to a salamander. What is new is the precision with which modern GIS tools can detect it.
Contemporary redistricting software allows mapmakers to import census block-level demographic data, voter registration files, and election results, then model thousands of alternative district configurations in a matter of hours. The same capability that enables sophisticated partisan mapmaking also enables its analysis. Researchers at universities including Princeton, Duke, and the University of Michigan have developed algorithmic approaches that generate large ensembles of simulated district maps drawn without partisan intent. When an enacted map falls far outside the statistical range of these simulations, it becomes a quantifiable indicator of manipulation.
This methodology has been introduced as evidence in federal and state court cases across the country. In North Carolina, Pennsylvania, and Ohio, plaintiffs have used GIS-based statistical analyses to successfully challenge maps drawn by state legislatures. The spatial record—the actual geometry of the districts and the demographic data layered beneath them—has proven to be a form of evidence that is difficult to dismiss.
Measuring the Shape of a District
Beyond ensemble analysis, GIS practitioners apply a range of geometric and spatial metrics to assess district fairness. Compactness measures—mathematical formulas that evaluate how closely a district's shape approximates a regular geometric form—are among the most widely used. A district that wraps around population centers of one demographic while excluding adjacent communities of another tends to score poorly on compactness indices, providing a quantitative basis for what might otherwise be a subjective visual judgment.
The efficiency gap, a metric developed by legal scholar Nicholas Stephanopoulos and political scientist Eric McGhee, uses precinct-level election returns to calculate the degree to which votes are systematically "wasted" in a map design—a phenomenon that can indicate deliberate packing and cracking of voter populations. When mapped spatially, efficiency gap calculations reveal geographic patterns of electoral advantage that raw vote totals alone cannot capture.
These tools are not without limitations. Courts have been reluctant to adopt any single mathematical standard as a constitutional threshold for gerrymandering, and the Supreme Court's 2019 ruling in Rucho v. Common Cause held that federal courts cannot adjudicate partisan gerrymandering claims. State courts, however, remain an active venue, and the spatial evidence produced by GIS analysis continues to play a significant role in those proceedings.
Polling Place Access and the Spatial Dimension of Voter Suppression
The geography of electoral fairness extends beyond district lines. Where polling places are located—and how accessible they are to different populations—is itself a spatial question with measurable consequences for voter participation.
Following the Supreme Court's 2013 decision in Shelby County v. Holder, which effectively suspended the preclearance requirements of the Voting Rights Act, numerous jurisdictions moved to consolidate or close polling locations. Research published by the Leadership Conference Education Fund documented the closure of more than 1,600 polling places in formerly covered jurisdictions in the years following the decision. GIS analysis of these closures revealed a consistent spatial pattern: reductions were disproportionately concentrated in counties with larger Black and Latino populations.
Organizations including the Brennan Center for Justice and the ACLU have employed spatial analysis to document these patterns, mapping polling place locations against demographic data, public transit routes, and driving distance calculations. The resulting visualizations make the accessibility disparities legible in ways that aggregate statistics cannot. A county that reports an average driving distance of four miles to a polling place may obscure the fact that, for residents of specific census tracts without vehicle access, the nearest location is twelve miles away with no transit connection.
Some state election officials have begun using GIS proactively to evaluate polling place siting decisions. Colorado, which operates a largely vote-by-mail system with supplemental vote centers, uses spatial analysis to ensure that in-person voting options are equitably distributed across geographic and demographic groups. Similar efforts are underway in Georgia and Arizona, though the political environment surrounding those initiatives remains deeply contested.
Transparency, Tension, and the Limits of Data
The growing role of GIS in electoral analysis raises questions that extend beyond methodology. Access to the underlying data—precinct-level election returns, voter file information, demographic breakdowns—varies considerably across states. Some jurisdictions publish detailed spatial datasets through open government portals; others restrict access in ways that limit independent analysis.
The tension between data transparency and political interest is particularly acute in states where the redistricting process remains under partisan legislative control. When the mapmakers also control access to the geographic data used to evaluate their maps, the potential for information asymmetry is significant. Advocacy groups have argued that full public disclosure of the spatial datasets used in redistricting should be a baseline requirement, a position that has gained traction in several states that have adopted independent redistricting commissions.
There is also the question of what spatial analysis can and cannot reveal. GIS tools can identify patterns, quantify disparities, and generate evidence. They cannot, on their own, resolve the underlying political disputes about what constitutes fair representation. That determination ultimately rests with courts, legislators, and voters.
What spatial analysis can do—and what it is increasingly doing—is make the geography of electoral decisions visible and legible to a broader public. In a democracy, the ability to see the lines that define representation, and to scrutinize the choices embedded in those lines, is not a technical matter. It is a civic one. GIS is providing the tools to make that scrutiny possible.